Traditional Species Diversity
By using species numbers and their richness for quantified the diversity.
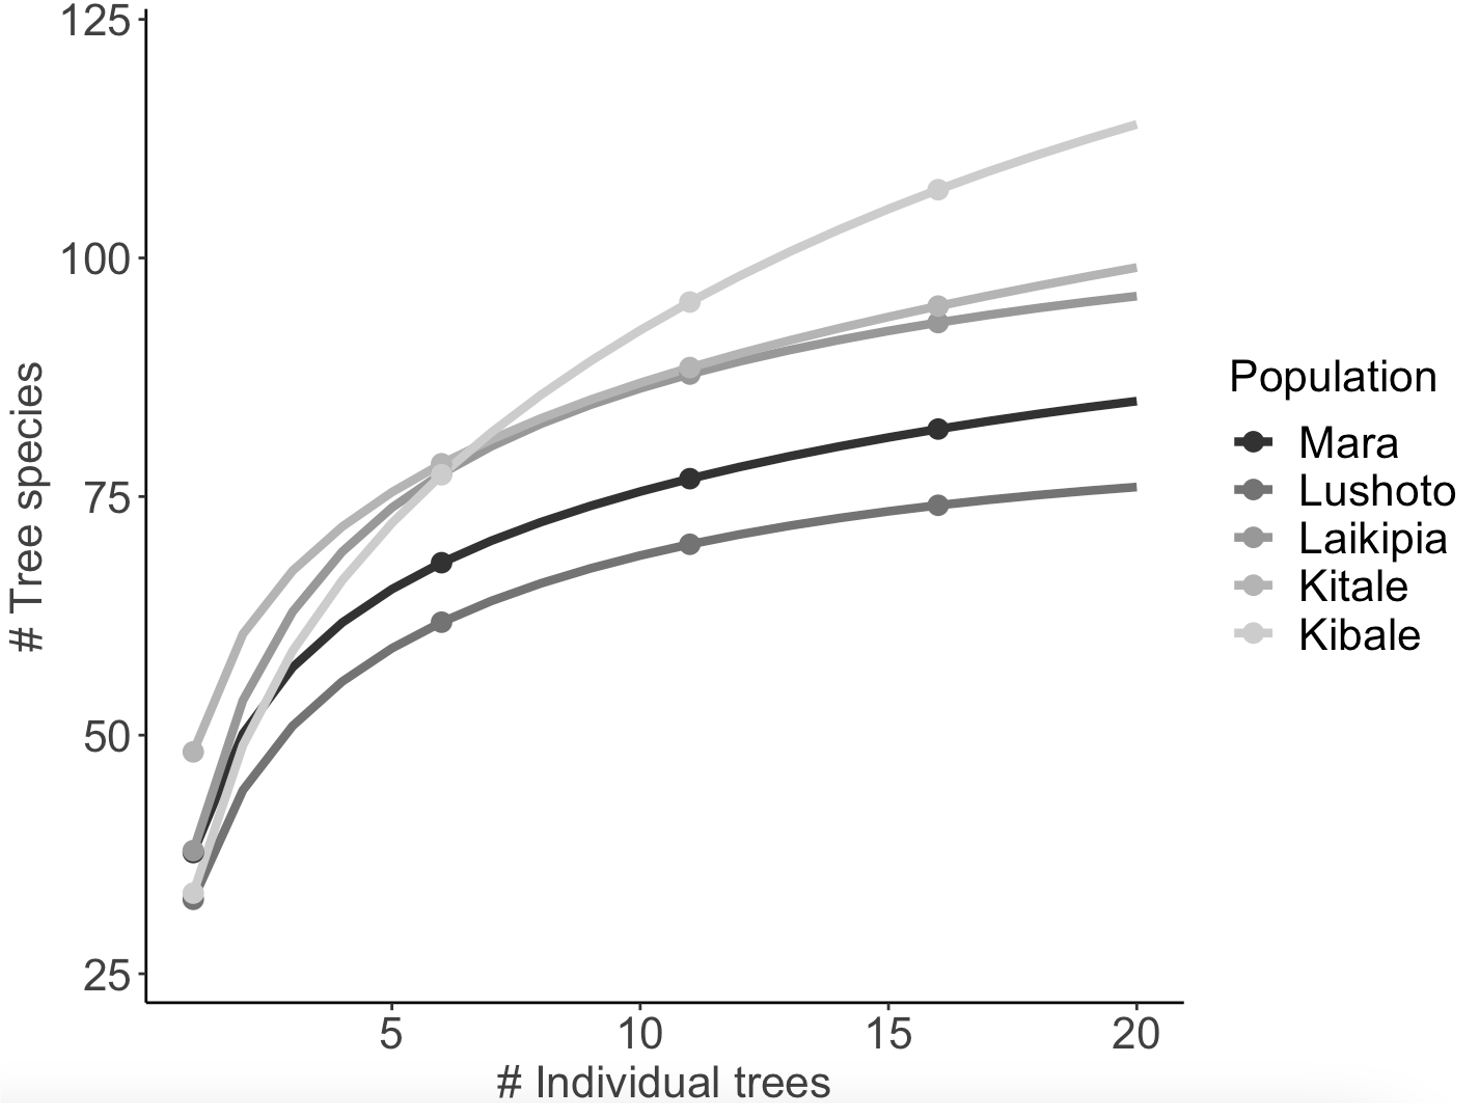
Curve fitting
describe the relationship between species numbers and the recorded individuals or areas. ex: species accumulation curve (SAC) or species-area curve
Examples
Data set warcom is a community data set, where variables (columns) correspond to different species. The same general principles for species accumulation curves apply of calculating the pooled number of species for different number of pooled individual trees.
Data set warenv is an environmental data set, where variables (columns) correspond to different descriptors of the sample sites. Population is a categorical variable that describes from which forest population trees were sampled.
library(BiodiversityR)
library(ggplot2)

## load data
data(warcom)
data(warenv)

## Step 1. Obtain the species accumulation result via function accumresult
Accum.1 <- accumcomp(warcom, y=warenv, factor='population',
                     method='exact', conditioned=FALSE, plotit=FALSE)
## Step 2. Extract data for plotting via function accumcomp.long
accum.long1 <- accumcomp.long(Accum.1, ci=NA, label.freq=5)

## Step 3. Use the extracted data to generate a plot with ggplot2
ggplot(data=accum.long1, aes(x = Sites, y = Richness, ymax = UPR, ymin = LWR)) +
  geom_line(aes(colour=Grouping), size=1.5) +
  geom_point(data=subset(accum.long1, labelit==TRUE),
             aes(colour=Grouping), size=3) +
  scale_color_grey()+
  labs(x = "# Individual trees", y = "# Tree species", colour = "Population")+
  theme_classic()
Parametric approach
Non-parametric approach
Shannon entropy
Uncertainty in the species identity of randomly sampled individual.
Assume that there are species in a community and denote the probabilities of species discovery by where .
Gini-Simpson index
Take two individuals, the probability that they are belong to different species.
The original Simpson index is which has inversely proportional to biodiversity, 2. normally, people use Gini-Simpson index:
The above two abundance-sensitive measurements have been widely used in many disciplines but both of them are not following the essential requirement of biodiversity--doubling property.
Doubling property
They are two equally large, completely distinct communities, each with the diversity measure . If combine these two communities, the diversity should be .
Hill numbers (effective number of species)
Traditional biodiversity