Chromatin Accessibility Analyses
Chromatin is composed of nucleosomes, consisting a histone octamer wrapped by DNA1. The interactions between histone proteins can change DNA structures:
- Closed: Nucleosome tightly packed regions, less accessible to regulatory components, cannot activate gene expression
- Open: Nucleosome-depleted regions, available to interact with regulators (TFs and enhancers), turn on gene expression
Background
ATAC-seq2 stands for Assay for Transposase-Accessible Chromatin with high-throughput sequencing. It allows us to identify the chromatin accessibility within a genome and requires fewer amounts of cells and time. ATAC-seq uses Tn5 transposase to enrich DNA fragments from open chromatin regions, followed by NGS sequencing (Fig.1).
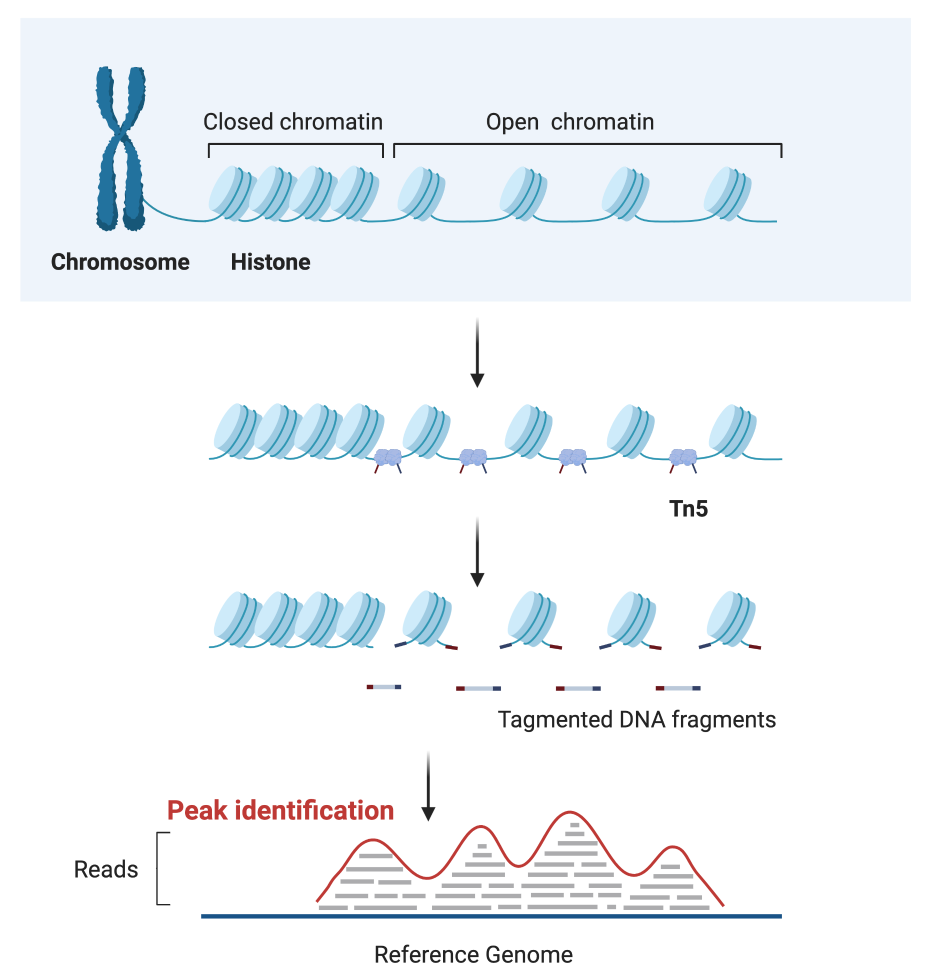
Fig1. Schematic of ATAC-seq library construction
Pipeline
ATACgrpah3 is a simple and effective software for the analysis of ATAC-Seq data. It can be download from GitHub with my modification. The pipeline starts from the aligned reads bam file.
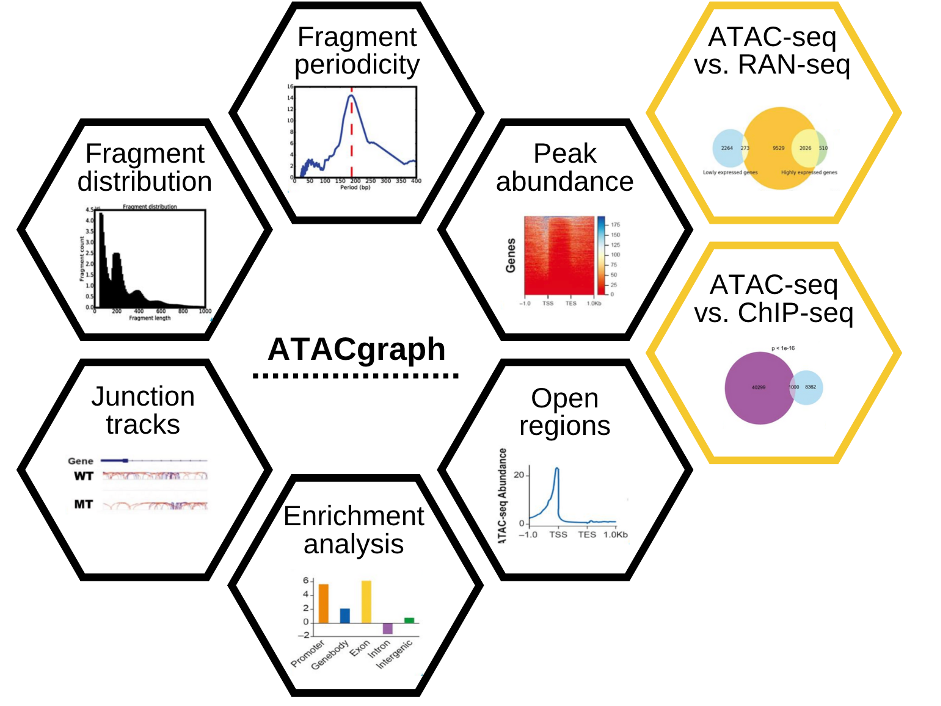
Fig2. Schematic diagram of ATACgraph. The black boxes are the ATAC-seq specific analyses while the yellow boxed are the comparison between ATAC-seq and other NGS methods.
step1: Removing mitochondrial
There are high abundance of mitochondrial reads (usually 20%–80%), therefore,
the first would be remove these mitochondrial or plastid sequences by 00_rmChr:
ATACgraph 00_rmChr demo.bam demo_rmM.bam chrM
step2: Quality control
Fragment length distribution and Fast Fourier Transform (FFT) can show the periodicity ATAC-seq framgment, as well as be used as a simple QC check. It should has a clear periodicity cut off at about 190-200 bp:
ATACgraph 01_calFragDist demo_rmM.bam demo_rmM_fragment demo_rmM_FFT
Two figures will be generated demo_rmM_fragment.png and demo_rmM_FFT.png
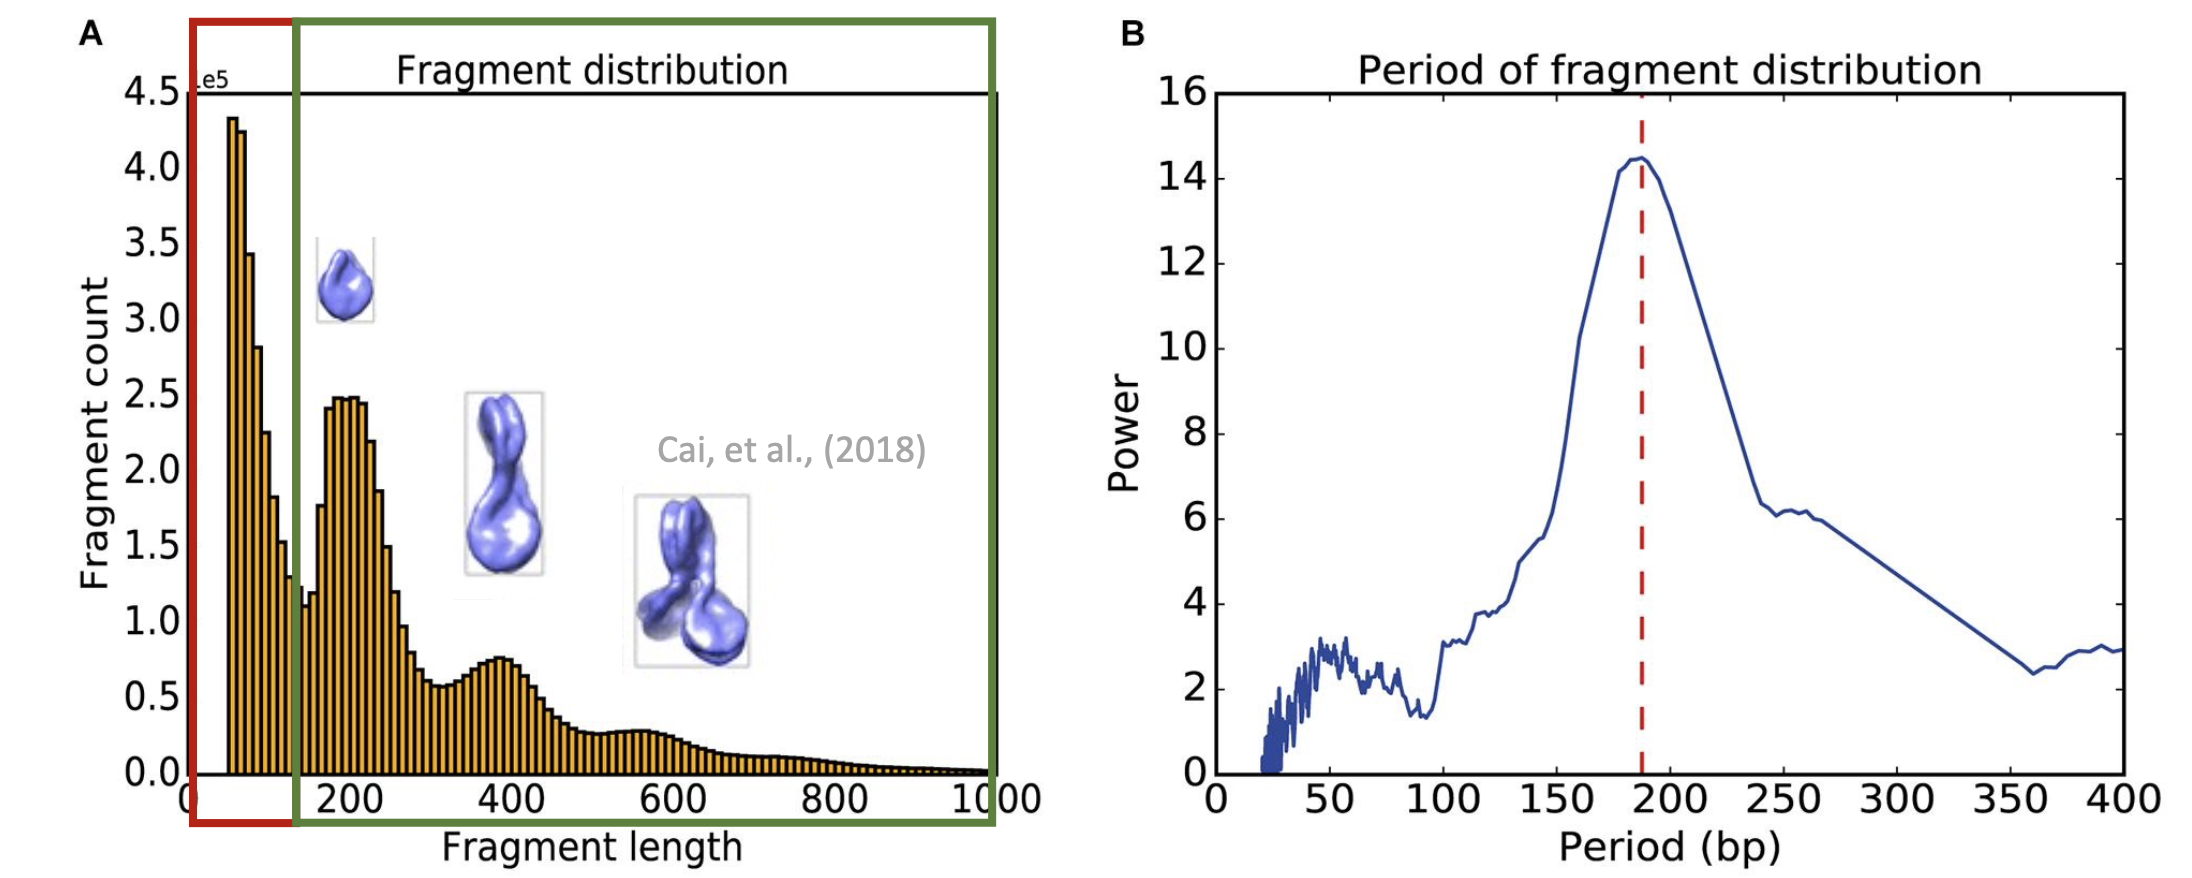
Fig3. The output figures of periodicity analyses. (A) Fragment length distribution with red box represent the nucleosome free region (NFR). The peaks in the gree box may be the mono-nucleosomes, di-nucleosomes and tri-nucleosomes. (B) The Fast Fourier Transform (FFT) show the clear period of fragment cut off is at about 195 bp.
step3: Peak calling
The updated version incorporates MACS3 (MACS2 in original ATACgraph) for peak calling that identifies nucleosome-occupied regions from full-extended fragments and nucleosome-free regions from integration regions:
ATACgraph 03_callPeak demo_rmM.bam demo_rmM_peakcall demo_gene_body_bed6.bed -p macs3
3 files will be generated including a peak location file demo_rmM_peakcall_peaks.narrowPeak, a peak intensity bigwig file demo_rmM_peakcall_coverage.bw, and a genes list of overlapping with peaks locations file demo_rmM_peakcall_peak_gene_list.txt.
step4: Transform GTF file to BED files
ATACgraph can transform the annotation gtf file into seperated bed file (promoter,gene,exon,intron,utr5,cds,utr3,igr) for the following analyses:
ATACgraph 02_gtftoBed demo_gene.gtf demo -p 2000
step5: Visualisation
peaks and genes
To investigate the chromatin accessibility around genes, ATACgraph uses the files describing the ATAC-seq peak locations and gene annotations. It can generate heatmap and metagene plots of ATAC-seq abundance and fold enrichment analysis of open regions in genomic features
ATACgraph 03_genePlot demo_rmM_peakcall.narrowpeak demo_rmM_peakcall_coverage.bw demo
3 figures will be plotted in pdf files as follow fig4 A-C.
junction
To identify a fragment junction track from paired-end reads which connects the start/end site of a read in the track. The lengths above 200 bp are the long fragments coloured in red; and the short fragments (< 150 bp) are marked to represent possibly NFRs in blue.
ATACgraph 03_junctionBed demo_rmM.bam demo_rmM_junction_output.bed
These outputs can be loaded into Integrative Genomics Viewer (IGV) to improve the recognition of open chromatin as fig4 D.
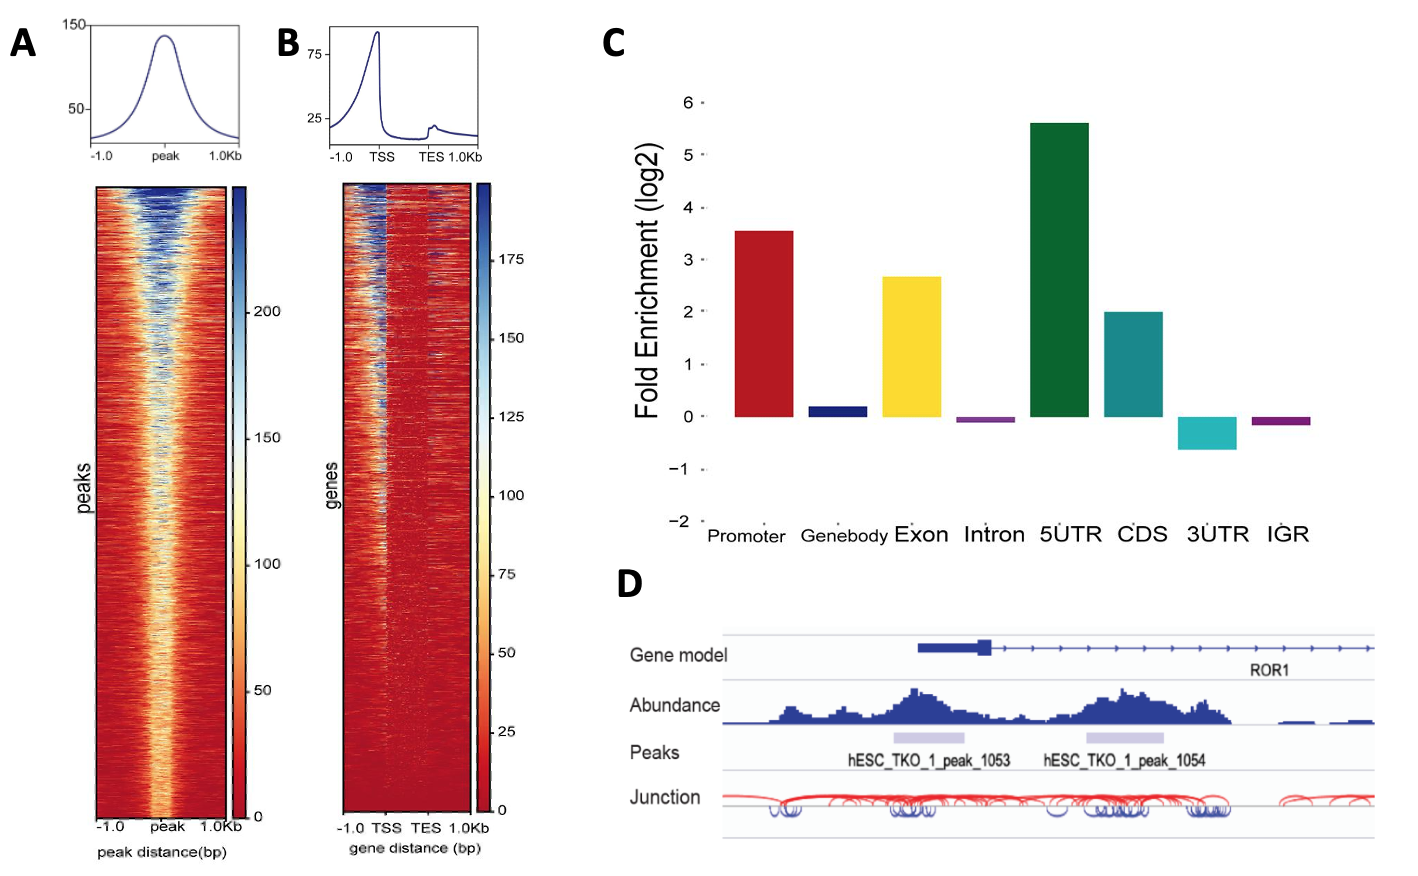
Fig4. The visualisation of (A) peaks abundance in metagene plot (top) and heatmap (bottom) show that ATAC-seq enriched at the center of the predicted peak locations and ;(B) ATAC-seq abundance of the gene body and flanking regions show the accessible regions are located before the transcription start sites (TSSs) in two-thirds of the genes. (C) Fold enrichment analysis of open regions in genomic features. (D) The junction tracks of ATAC-seq in the genome.
Quality assessment
To make sure ATAC-seq or ChIP-seq quality, a manual 4 was conducted by ENCODE. One of the most popular evaluation score for qc these seqs is Fraction of all mapped Reads that fall into peak regions (FRip) Score. It represents the percentage of reads in the peaks region, while the reads outside the peaks are consider as noise.
FRip socre
FRip can be calculated by the featureCounts but the .narrowPeak file should first be converted to .saf file format.
awk 'OFS="\t" {print $1"-"$2+1"-"$3, $1, $2+1, $3, "+"}' demo_rmM_peakcall.narrowPeak > demo_rmM_peakcall.SAF
featureCounts -p -a demo_rmM_peakcall.SAF -F SAF -o demo_rmM_peakcall.txt demo_rmM_peakcall.bam
IDR
Normally, the experiments required at least two biological replicates and the peaks should maintain highly consistance between these two. We can use Irreproducibility Discovery Rate (IDR) 5 for the assessment.
idr --samples YJATAC0432_rmM_peakcall_peaks.narrowPeak YJATAC0433_rmM_peakcall_peaks.narrowPeak --input-file-type narrowPeak --rank p.value --output-file YJATAC32-33-idr --plot --log-output-file YJATAC32-33.log