DNA Methylation Analyses
Background
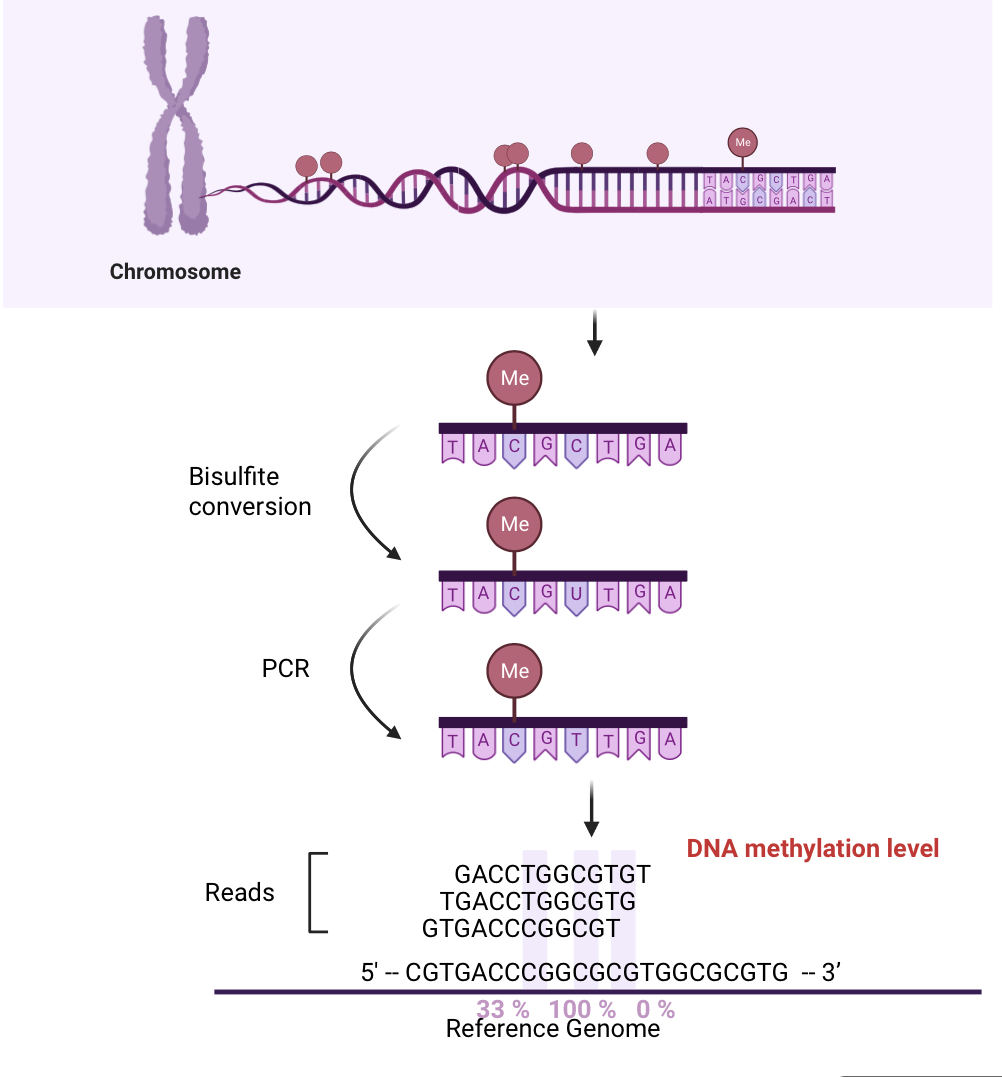
Fig1. Schematic of BS-seq library construction
Pipeline
Step1: Alignment
BS-seeker2 allows user to map the BS-seq/EM-seq to the reference genome by applying three-letter algorithm.
# build index
python bs_seeker2-build.py -f genome.fa --aligner=bowtie2 -d ./BS2_bt2_Index
# mapping (single-end)
python bs_seeker2-align.py -i WGBS_WT_rmdup.fastq.gz -g genome.fa --
aligner=bowtie2 -o WGBS_WT.bam -m 3 -d ./BS2_bt2_Index
# mapping (paired-end)
python bs_seeker2-align.py -1 output_R1_paired.fq.gz -2 output_R2_paired.fq.gz -g
genome.fa --aligner=bowtie2 -o WGBS_align.bam -m 3 -
d ./Built_Index
After mapping, there are two files, one is WGBS.bam file and the log file WGBS_WT.bam.bs_seeker2_log, showing the mappability.
Step2: Call methylation
In this step, BS-seeker2 calculated the methylation level of each cytosines within each read of sample.
python bs_seeker2-call_methylation.py -i WGBS_WT.bam -o
WGBS_WT_out -d /BS2_bt2_Index/genome.fa_bowtie2
The text file CGmap WGBS_WT_out.CGmap.gz shows the methylation level of each content.
Step3: Calculating conversion rate
The bisulfite conversion rate refers to the proportion of cytosine residues that are successfully converted to uracil during the bisulfite conversion process. It can be calculated by comparing to the lambda phage DNA which contains unmethylated cytosines and methylated cytosines at specific sites. The steps for analysis lambda phage DNA is the same as the BS-seq samples above.
# build index
python bs_seeker2-build.py -f lambda_genome.fa --aligner=bowtie2 -d ./lambda_BS2_bt2_Index
# mapping (single-end)
python bs_seeker2-align.py -i WGBS_WT_rmdup.fastq.gz -g lambda_genome.fa -- aligner=bowtie2 -o lambda_WT.bam -m 3 -d ./lambda_BS2_bt2_Index
# call methylation
python bs_seeker2-call_methylation.py -i lambda_WT.bam -o
lambda_WT_out -d lambda_BS2_bt2_Index/lambda_genome.fa_bowtie2
To calculate the conversion rate the equation is
in which I have a R script for Calculating conversion rate
Step4: Visualisation
DNA methylation profiles
The tool MethGO is able to plot the basic charts for methylation levels.
methgo met gene.gtf genome.fa demo.CGmap
Three figures will be plotted including a DNA methylation bar chart demo.bulk.mean.png for three different content (CG, CHG, and CHH); a meta plot for methylation levels along chromosomes demo.genomewide.png; and a histogram for methylation levels distribution demo.bulk.hist.png.