Histone Modification Analyses
Histone modifications is a covalent post-translational modification (PTM) to histone marks such as methylation, acetylation, phosphorylation, ubiquitylation, and sumoylation which are key epigenetic regulators that control chromatin structure and gene expression.
Background
ChIP-seq1 stands for Chromatin Immunoprecipitation followed by Sequencing. It uses an antibody for a specific DNA-binding protein or a histone modification to identify enriched loci within a genome. Next-generation sequencing (NGS) technology and computational analysis allow us to characterise and the biological functions of epigenetic signatures (Fig.1).
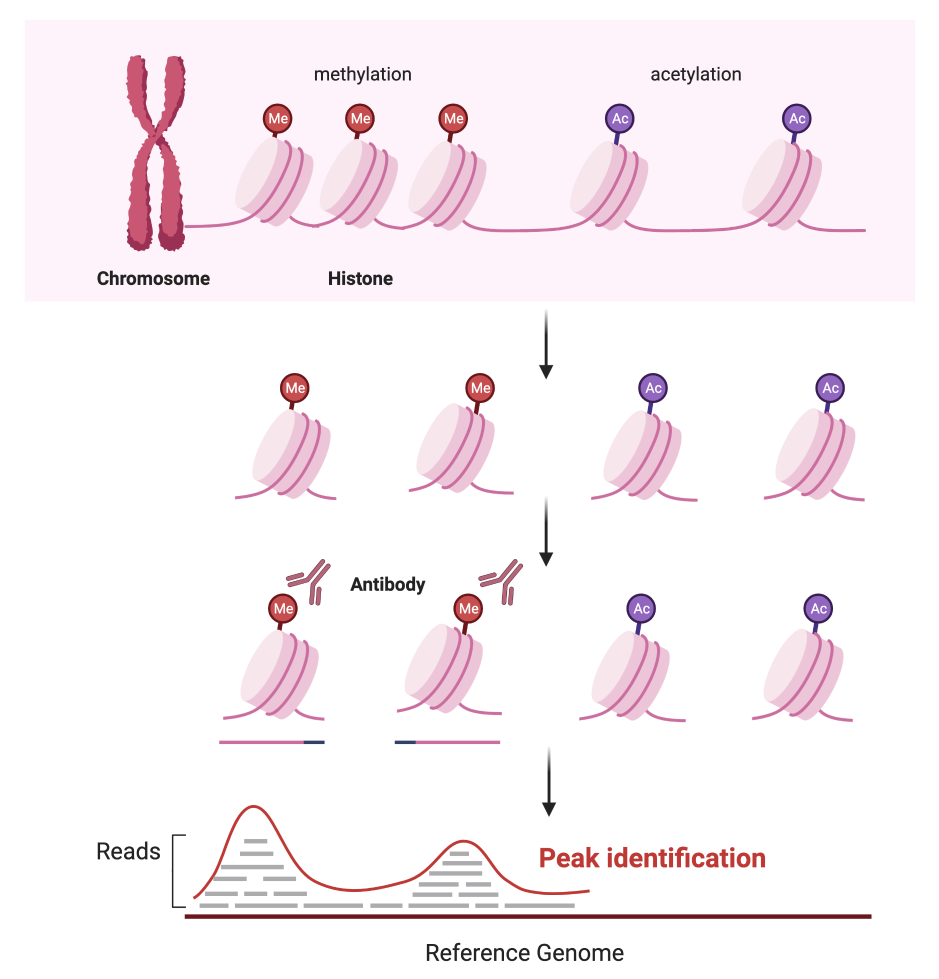
Fig1. Schematic of ChIP-seq library construction (histone chips)
Pipeline
step1: Peak calling
the Model-based Analysis of ChIP-Seq (MACS32 ), for identifying histone/transcript factor binding sites.
macs3 callpeak -t Histone.bam -f BAM -c Control.bam -g 1.35e8 -n Histone
four outputs will be generated, including peak file Histone_peaks.narrowPeak (Fig.2), peak location Histone_summits.bed, a list of called peaks Histone_peaks.xls, and an R script for producing a PDF figure Histone_model.r.
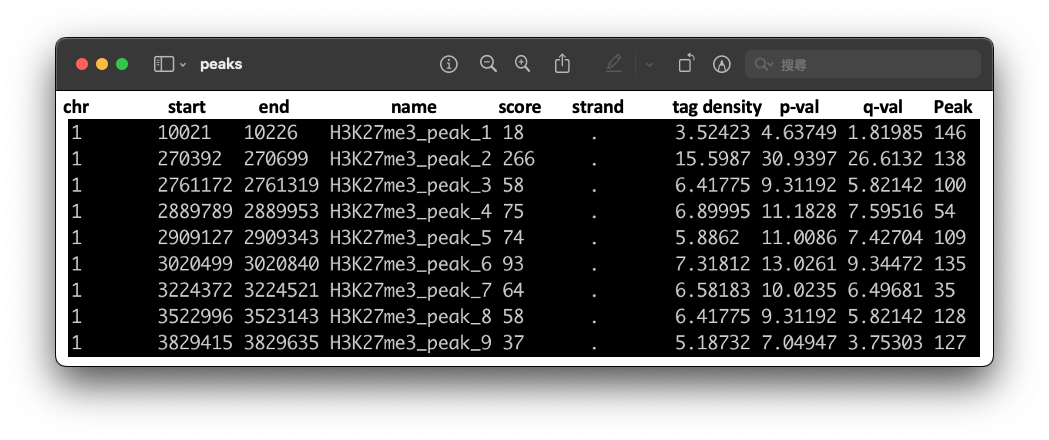
Fig2. The .narrowPeaks file.
step2: Visualisation
peaks and genes
To investigate the histone modifications, deeptools3 can generate bigwig file and metagene plots of ChIP-seq abundance:
bamCoverage -b Histone.bam -o Histone.bw -bs 20 --ignoreDuplicate -e 100 --samFlagExclude 1796 --normalizeUsing CPM -p 20
computeMatrix reference-point -S Histone.bw -R Histone_TSS.bed -a 2000 -b 2000  -o  Histone_matrix.gz
plotProfile -m Histone_matrix.gz -o Histone.png
The file Histone.bw from bamCoverage can be loaded into Integrative Genomics Viewer (IGV) as fig3 A.
The Histone.png generated from Histone_matrix.gz shows the ChIP-seq abundance around TSS site.
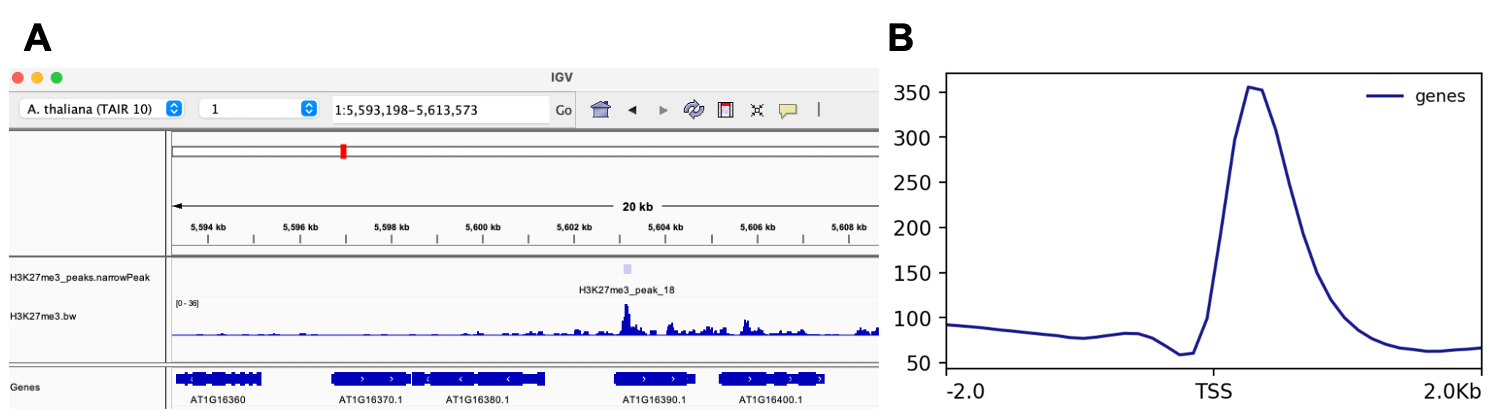
Fig3. The visualisation of (A) peaks and histone binding sites in the genome, and (B) the meta plot of ChIP-seq abundance around TSS site.